
Modern digital teams are under constant pressure to improve conversions, engagement, and user satisfaction. Traditional analytics explain what is happening on a website, but they rarely explain why. This gap has led to the rise of platforms that combine experimentation with behavioral insights, particularly heatmap A/B testing tools like VWO. By merging visual interaction data with controlled experiments, businesses gain a clearer picture of how users truly behave—and how to turn those insights into measurable growth.
TLDR: Heatmap A/B testing tools like VWO combine behavioral data with controlled experiments to show not only what users do, but why they do it. Heatmaps reveal click, scroll, and movement patterns, while A/B tests validate which changes improve performance. Together, they eliminate guesswork and accelerate conversion optimization. Organizations that integrate both approaches make more confident, data-driven decisions.
The Evolution of Conversion Optimization
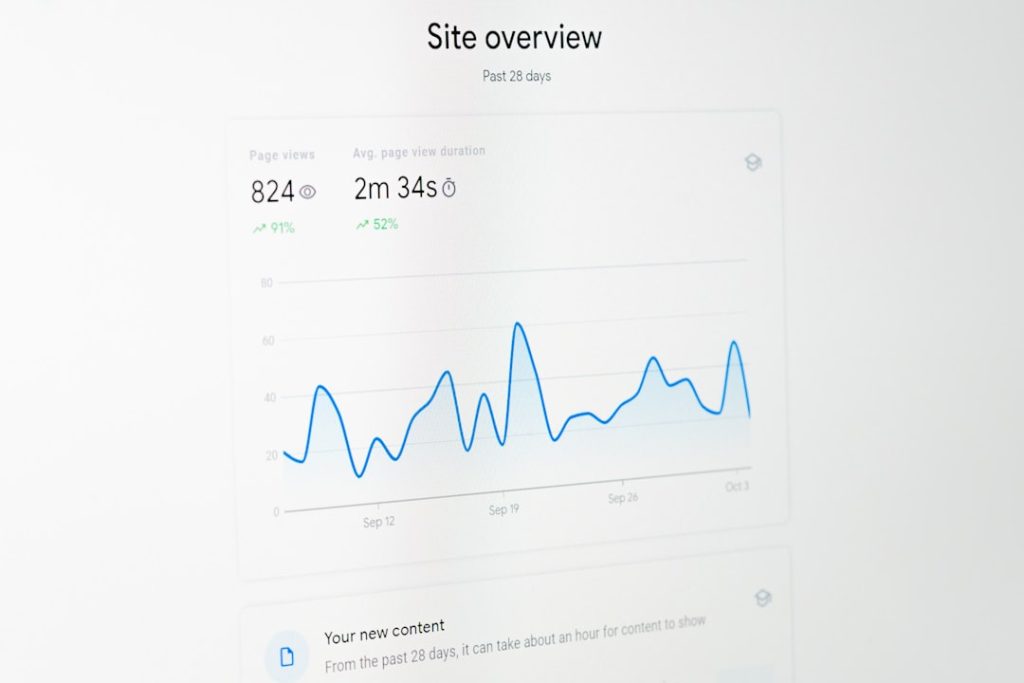
In the early days of web analytics, businesses relied heavily on metrics such as bounce rate, time on site, and conversion rate. While useful, these numbers lacked context. If a landing page underperformed, marketers could see the drop in conversions—but they could not see friction points or user confusion.
Heatmap technology changed that by offering visual representations of user behavior. Instead of reading rows of numbers, teams could observe where visitors clicked, how far they scrolled, and where attention concentrated.
However, heatmaps alone are observational. They can highlight problems—like ignored buttons or misleading design—but they do not confirm whether a specific redesign will work better. This is where A/B testing tools like VWO create synergy. Controlled experiments validate changes statistically, transforming insights into proven improvements.
What Are Heatmap A/B Testing Tools?
Heatmap A/B testing tools integrate two powerful functionalities into a single platform:
- Heatmaps – Visual data overlays showing user interactions, including clicks, taps, scroll depth, and mouse movements.
- A/B or multivariate testing – Controlled experiments that compare different versions of a webpage to measure performance differences.
Platforms like VWO allow teams to move seamlessly from insight discovery to experimentation. For example, if a heatmap shows users are ignoring a call-to-action button, marketers can redesign it and immediately launch an A/B test to measure the impact.
This integration removes friction between data analysis and implementation.
Types of Heatmaps That Enhance Experiments
Effective experimentation relies on knowing which elements influence user behavior. Heatmap tools provide various visual layers to support that process.
1. Click Heatmaps
Click heatmaps use color gradients to show which areas receive the most interaction. Warm colors indicate heavy activity, while cooler colors show low engagement.
These maps are especially useful for identifying:
- Distracting elements that attract unintended clicks
- Buttons that users ignore
- Areas mistakenly perceived as clickable
2. Scroll Heatmaps
Scroll maps display how far down users travel on a page. If most visitors never reach a pricing table or sign-up form, it becomes clear that repositioning may be necessary before testing design changes.
3. Move or Attention Heatmaps
While not a perfect measure of eye tracking, mouse movement can approximate user attention patterns. These insights often guide headline placement and content hierarchy experiments.
Why Combine Heatmaps With A/B Testing?
Heatmaps diagnose; A/B tests prescribe. When used together, they form a complete optimization cycle.
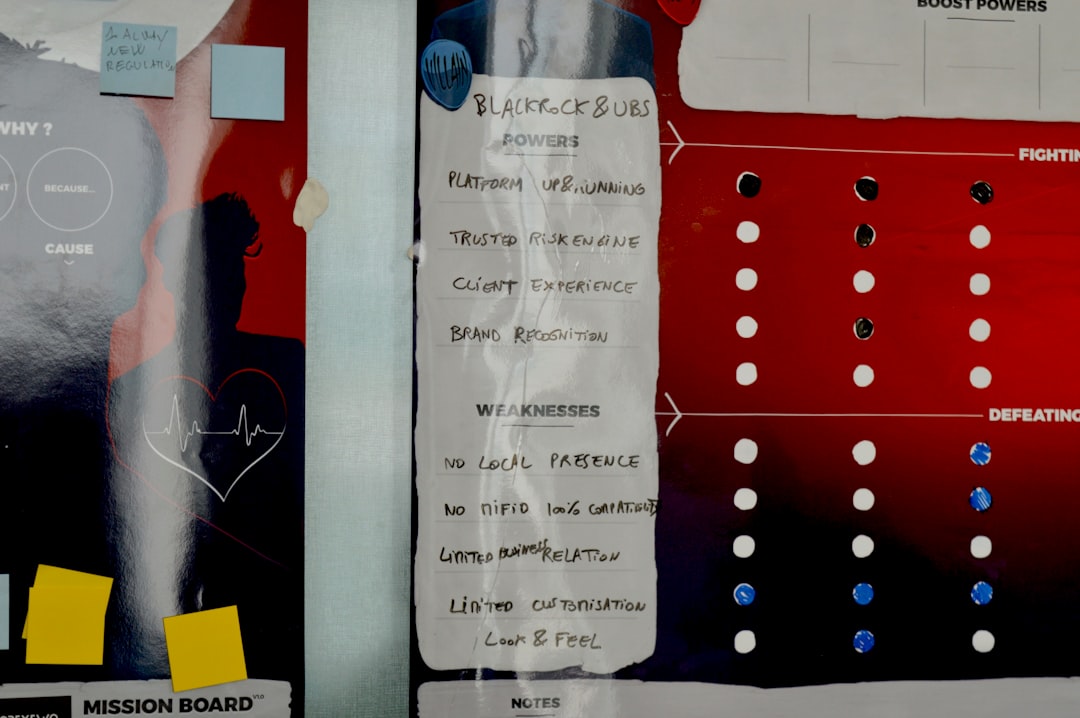
Improved Hypothesis Generation
Instead of guessing why a page underperforms, teams can build hypotheses based on visual evidence. For example:
- Heatmap insight: Users stop scrolling before reaching testimonials.
- Hypothesis: Moving testimonials higher will improve conversions.
- Experiment: A/B test original layout versus redesigned layout.
Faster Experiment Prioritization
Data from heatmaps helps teams focus on high-impact areas first. Rather than testing minor color adjustments randomly, they address obvious friction points that influence user behavior.
Increased Statistical Confidence
When experiments confirm insights drawn from behavioral data, confidence in decision-making rises. Organizations move from opinion-driven changes to evidence-based growth strategies.
Key Features of Platforms Like VWO
Comprehensive heatmap A/B testing tools provide more than just visual analytics. They include advanced features designed to support robust experimentation programs.
1. Segmentation Capabilities
Not all users behave the same way. Platforms allow filtering by:
- Device type (desktop, tablet, mobile)
- Traffic source
- Geographic location
- New vs returning visitors
This segmentation ensures that experimentation targets the right audience.
2. Session Recordings
Beyond static heatmaps, session replays provide playback-style views of individual user journeys. Observing hesitation, repeated clicks, or abandoned forms deepens understanding before launching tests.
3. Visual Editor for Experiment Setup
Many modern platforms include a visual editor that allows marketers to create design variations without developer support. This democratizes experimentation and reduces turnaround time.
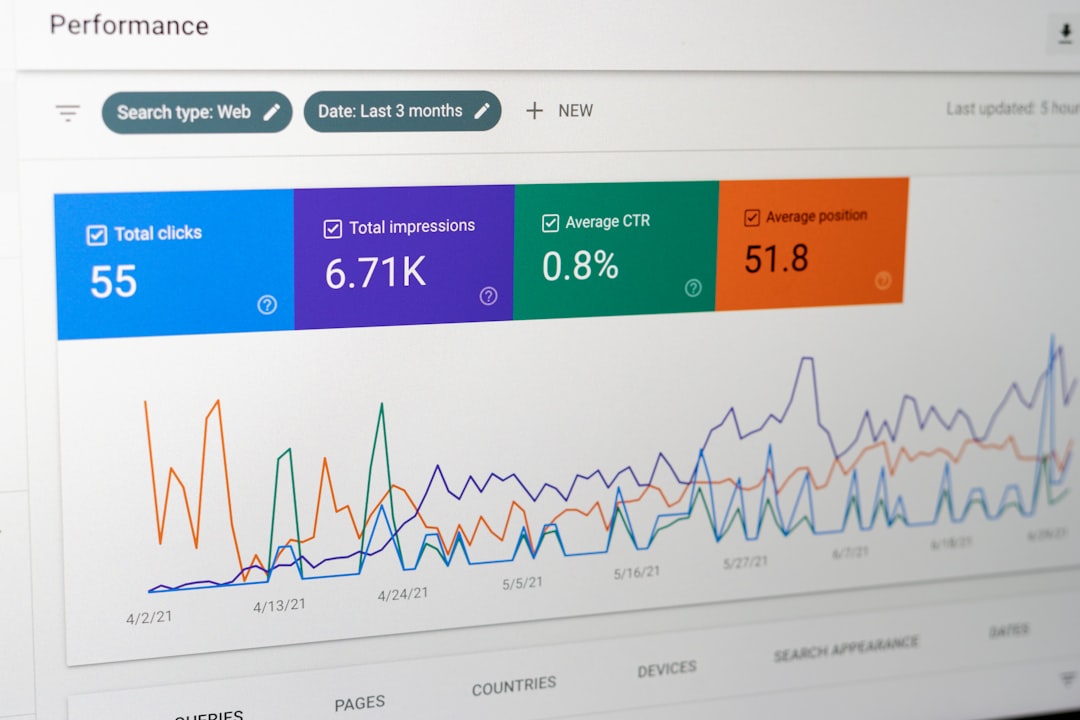
4. Statistical Analysis Engine
Reliable A/B testing requires robust statistical modeling. Tools calculate probability to beat control, confidence intervals, and conversion uplift to guide informed decisions.
Practical Workflow: From Insight to Implementation
An effective optimization cycle typically follows these steps:
- Collect Behavioral Data: Use heatmaps and session recordings to identify friction points.
- Form a Clear Hypothesis: Define why a change should improve performance.
- Create Variations: Design alternative layouts or content structures.
- Launch an A/B Test: Split traffic evenly to measure impact.
- Analyze and Deploy: Implement winning variations permanently.
For example, an ecommerce store might discover via scroll heatmap that only 40% of users reach product reviews. By relocating reviews closer to the product description and testing the new layout, they may achieve a measurable increase in add-to-cart rates.
Common Use Cases Across Industries
Ecommerce
- Optimizing product page layouts
- Reducing cart abandonment
- Improving checkout usability
SaaS Platforms
- Increasing free trial sign-ups
- Enhancing onboarding flows
- Testing pricing page structures
Publishing and Media
- Boosting article engagement
- Improving subscription placements
- Increasing ad visibility without harming UX
Each of these industries benefits from blending behavioral intelligence with controlled experimentation.
Best Practices for Success
Implementing heatmap A/B testing tools effectively requires discipline and strategic focus.
- Avoid acting on small data samples. Ensure adequate traffic before drawing conclusions.
- Test one major variable at a time. Isolate changes to attribute results accurately.
- Document learnings. Even failed experiments provide insights for future improvements.
- Focus on user intent. Optimization should enhance user experience, not manipulate behavior.
Organizations that treat optimization as an ongoing program rather than a one-time effort see sustainable growth over time.
Challenges and Limitations
Despite their advantages, these tools are not magic solutions.
- Misinterpreting heatmaps: High click density does not always equal positive engagement.
- Statistical misunderstandings: Ending tests too early can produce misleading results.
- Over-testing: Running too many simultaneous experiments may fragment traffic and delay conclusions.
Successful teams combine technical competency with analytical rigor to maximize impact.
The Future of Heatmap Experimentation
As artificial intelligence and machine learning evolve, experimentation platforms are becoming more predictive. Automated insights, anomaly detection, and adaptive experimentation are reducing manual workload.
In the coming years, businesses can expect deeper integrations between qualitative and quantitative data. Heatmaps will become more intelligent, offering contextual suggestions rather than raw overlays. Meanwhile, experimentation engines will dynamically adjust traffic allocations to accelerate statistically significant outcomes.
The core principle remains unchanged: understanding users leads to better experiences, and better experiences drive growth.
Conclusion
Heatmap A/B testing tools like VWO represent a strategic evolution in digital optimization. By combining visual behavioral insights with rigorous experimentation, they help organizations bridge the gap between observation and action. Instead of relying on intuition or isolated metrics, businesses gain a full-cycle optimization framework grounded in evidence.
When implemented thoughtfully, these tools transform websites into continuously improving systems—driven not by guesswork, but by data-backed insights and validated experiments.
FAQ
1. What makes heatmap A/B testing tools better than using separate tools?
Integrated platforms streamline workflows by connecting behavioral insights directly with experimental capabilities. This reduces friction, saves time, and improves hypothesis accuracy.
2. Are heatmaps alone enough for conversion optimization?
No. Heatmaps show where users interact but do not prove which design changes improve performance. A/B testing validates whether modifications lead to statistically significant improvements.
3. How long should an A/B test run?
Tests should run long enough to collect statistically significant data, typically at least one to two business cycles. Ending too early can skew results.
4. Can small websites benefit from these tools?
Yes, but sufficient traffic is necessary for meaningful experiments. Smaller websites may need to run tests longer to reach statistical confidence.
5. Do heatmaps violate user privacy?
Reputable platforms anonymize user data and comply with privacy regulations. Businesses should still disclose tracking practices in their privacy policies and follow applicable laws.
6. What metrics should teams focus on during experiments?
Primary metrics typically include conversion rate, revenue per visitor, or form completions. Secondary metrics like bounce rate and engagement depth provide supporting context.